Home›Insights›Same Maturity, Different Roadmap, Part 1
Login
Please wait...!
Insights
Strategic Planning
Same Maturity, Different Roadmap, Part 1
A single maturity score can hide two opposite realities; only a dimension-level diagnosis and a tailored roadmap reveal what an organization should actually improve.
by GPA Unit | 08 July 2026
| Share on
A maturity assessment produces a score, and the score attracts attention. It is easy to communicate, easy to benchmark and easy to track over time. However, the score is only one of the outputs, and in practice it is rarely the most useful one.
A complete maturity assessment provides three complementary deliverables, each serving a different purpose:
Maturity assessment report – presents the findings, evidence, strengths, development opportunities and detailed analysis.
Executive dashboard – provides a one-page visual summary of the organization's maturity profile.
Roadmap for improvement – prioritizes recommendations and outlines the steps required to progress to higher maturity levels.
Among these deliverables, organizations consistently find the roadmap to be the most practical. The report explains the current state; the roadmap defines what should improve next, and in what order.
The reason becomes clear when two organizations with the same overall score are placed side by side.
A Case Study of Two Organizations
Organization A – Strong culture, weak systems
Organization A is a people-first organization. Trust is high, purpose is shared, and teams learn quickly. When a problem appears, someone steps up and solves it. Coordination happens through relationships rather than procedures, and decisions move fast because people know and trust one another.
The weakness sits underneath this strength: execution depends on individuals, not on systems. When a key manager is unavailable, the process that manager carried in their head stalls. Results are real, but they are uneven across teams and difficult to evidence. The organization performs well and struggles to prove it, repeat it or scale it.
Organization B – Strong systems, weak culture
Organization B is a process-first organization. Processes are defined and documented, metrics are tracked, and execution is disciplined. Reporting arrives on schedule, plans are followed, and performance data is available to anyone who asks for it.
Its weakness is the mirror image of Organization A's. People follow the system rather than own it. Targets are met because they are required, not because they are believed in. The risk is compliance over commitment: an organization that does everything correctly and generates little energy while doing so.
Looking Beyond the Overall Score
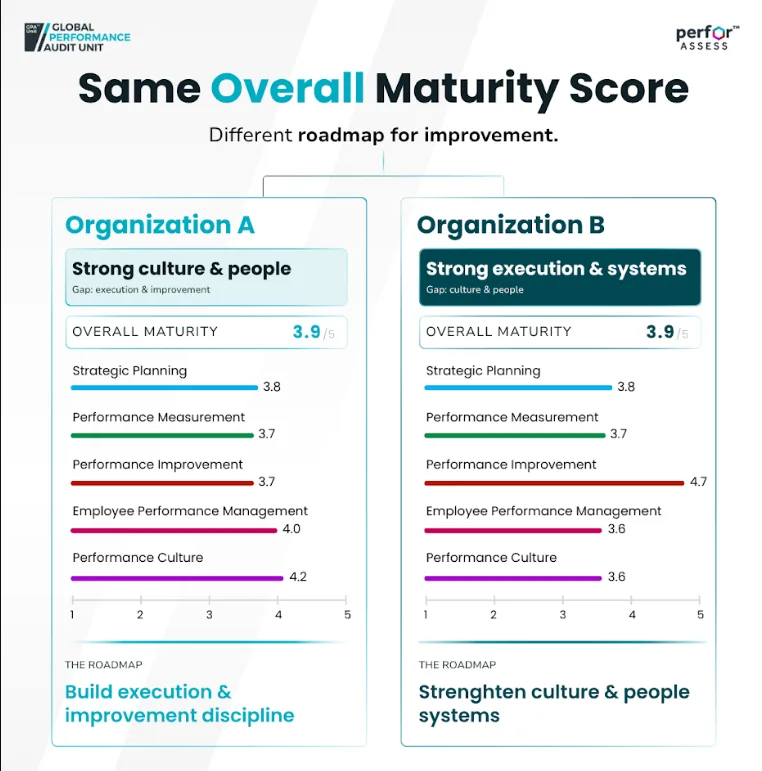
Both organizations completed the same maturity assessment, covering the five capabilities of the GPA Unit maturity model: Performance Culture, Employee Performance Management, Strategic Planning, Performance Measurement, and Performance Improvement. Both achieved an overall maturity of 3.9 — an organization at Advanced level, where practices are embedded and institutionally governed rather than merely formalized.
The first differences appear at the capability level. Organization A scores highest where people carry the system: Performance Culture (4.2) and Employee Performance Management (4.0). Organization B's standout capability is Performance Improvement (4.7), while Performance Culture and Employee Performance Management (both 3.6) are its lowest scores — the profile of an organization that refines its processes more readily than it engages its people.
The more striking observation, however, concerns the two remaining capabilities. In Strategic Planning, both organizations scored 3.8. In Performance Measurement, both scored 3.7. Read at this level, the two organizations appear interchangeable in exactly the areas this article examines. It is only at the dimension level — the layer beneath each capability — that the assessment reveals how differently two organizations can earn the same number. In both capabilities, Organization A and Organization B are close to mirror images: strong precisely where the other is weak. And because the diagnosis differs, so does everything that follows from it.
Two organizations, one score, and two profiles that are close to mirror images. The implication is direct: the same score cannot lead to the same recommendations.
Strategic Planning: Two Opposite Patterns
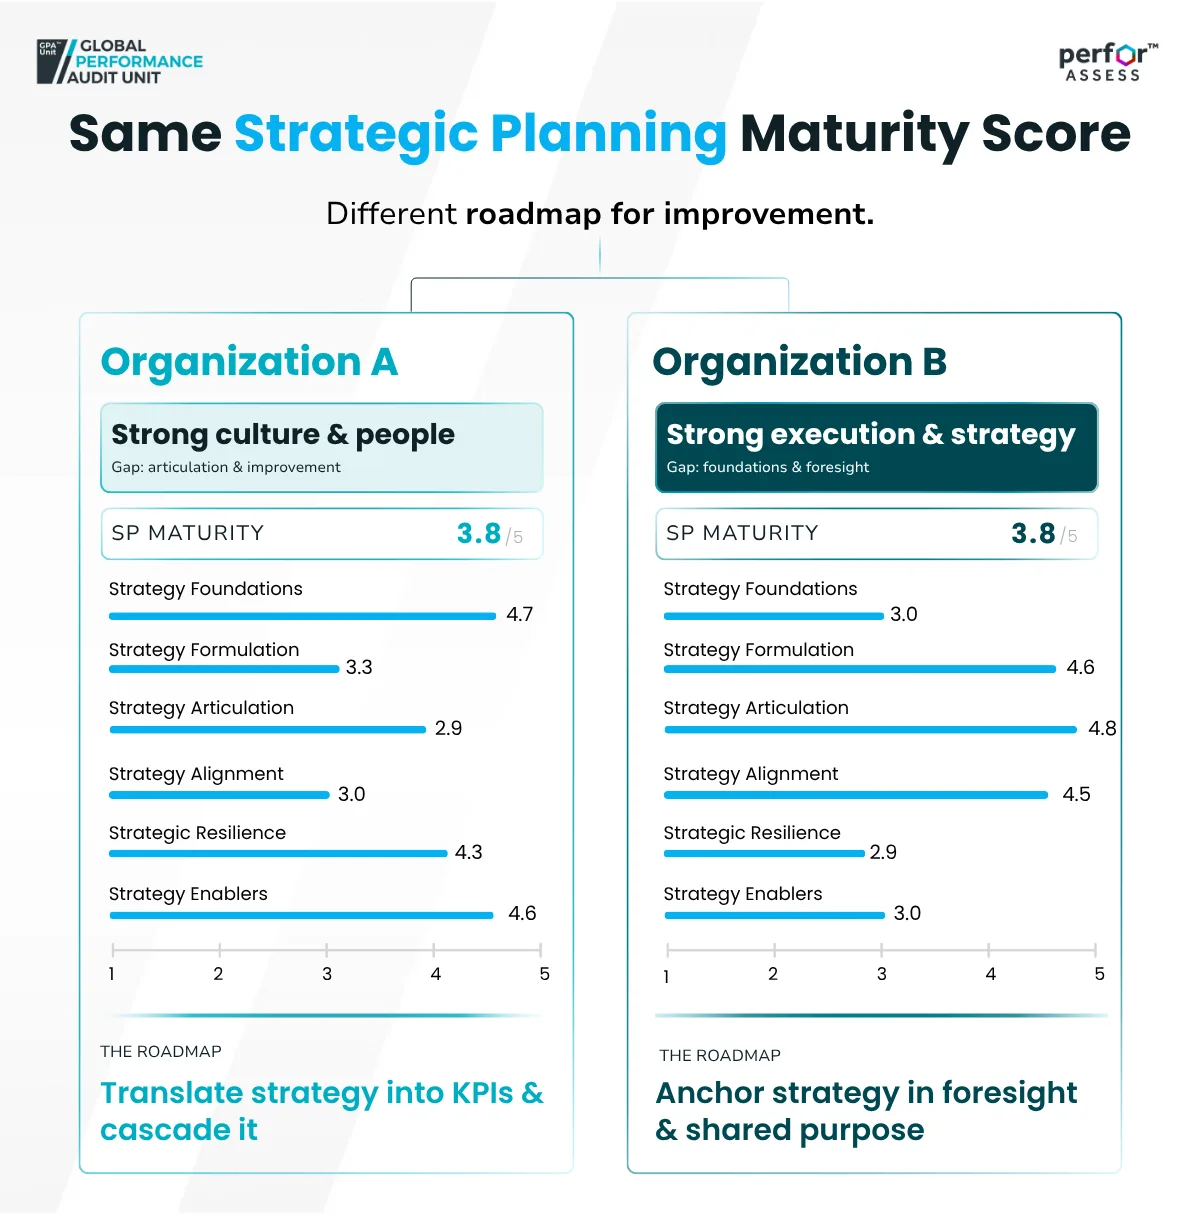
Both organizations scored 3.8 in Strategic Planning. Across the six dimensions of the capability, they share almost nothing.
Organization A's strengths sit at the beginning and the edges of the strategy cycle.
Strategy Foundations scores 4.7 — at the Leading level, where mission, vision, and values are inspirational and genuinely embedded in the culture. People do not need to consult the strategy document to know what the organization stands for.
Strategic Resilience (4.3) and Strategy Enablers (4.6) confirm the pattern: the organization revisits its direction regularly, adapts when circumstances change, and supports planning with sound governance and skills.
Its weaknesses sit in the middle of the cycle, where direction must become structured.
Strategy Articulation scores 2.9 — at the Structured level: the layers of strategy exist, but the translation into objectives, KPIs, and initiatives is the least developed part of the cycle
Strategy Alignment (3.0) and Strategy Formulation (3.3) follow closely.
The organization knows where it is going and why; what it lacks is the disciplined translation of that direction into concrete objectives, indicators, initiatives, and cascaded operational plans. Strategy exists as shared understanding rather than as an articulated, monitorable plan — which is exactly how a strong-culture, weak-systems organization would hold its strategy.
Organization B presents the inverse profile.
Strategy Articulation (4.8), Strategy Formulation (4.6), and Strategy Alignment (4.5) are all at Leading level: strategy is defined through rigorous research, translated into a robust architecture of objectives, KPIs, and initiatives, and systematically cascaded into operational plans linked to accountability.
The planning machinery is close to exemplary.
What the machinery lacks is anchoring and adaptability.
Strategy Foundations scores 3.0 — the mission and vision are communicated, but not embedded in behavior; the plan is technically excellent yet not carried by shared identity.
Strategic Resilience scores 2.9, the lowest dimension in the profile: strategy review is infrequent, and foresight and contingency planning are not established practices.
Organization B has built a precise plan and executes it faithfully — but a plan that is neither owned by its people nor stress-tested against change is precise and brittle at the same time.
The same 3.8 describes two opposite conditions: an organization with deep direction and an underdeveloped plan, and an organization with an exceptional plan and underdeveloped direction.
Performance Measurement: Capability vs. Dependence on Individuals
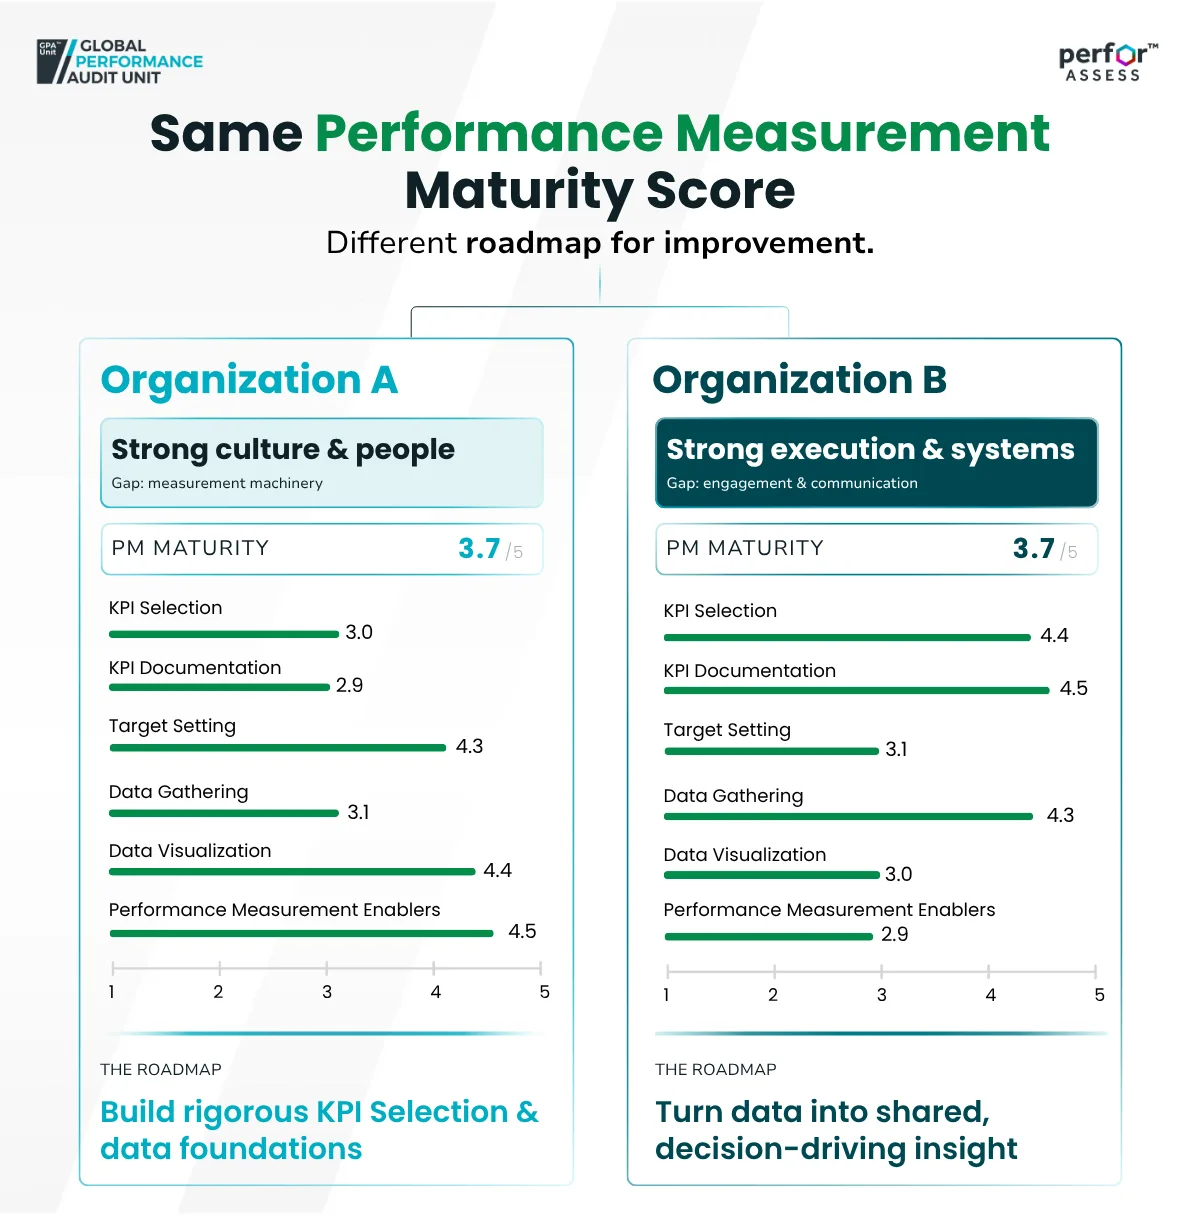
The mirror image repeats in Performance Measurement, where both organizations scored 3.7.
Organization A is strongest in the dimensions where measurement meets people.
Target Setting (4.3) reflects genuine analysis and stakeholder engagement behind the targets — numbers that are negotiated and understood, not imposed.
Data Visualization (4.4) and PM Enablers (4.5) indicate an organization that communicates performance effectively and invests in the skills and governance around measurement.
Its weaknesses are the machinery itself.
KPI Selection scores 3.0: a selection process exists at corporate level, but nothing is standardized at operational levels — typically the stage where organizations accumulate an oversized KPI library and struggle to identify what matters.
KPI Documentation scores 2.9, which means that documentation exists as a basic template, but is not yet detailed enough to guarantee consistent measurement across teams.
Data Gathering (3.1) remains largely manual and burdensome.
Measurement in Organization A works because capable, committed people make it work. The results are real, but they rely on individual effort rather than organizational capability — uneven, difficult to audit, and vulnerable to the departure of key people.
Organization B has built precisely the machinery that Organization A lacks.
KPI Documentation (4.5), KPI Selection (4.4), and Data Gathering (4.3): formal selection rules, detailed and reliable KPI documentation, and digitalized, efficient data collection producing accurate results.
The measurement system itself is one of the most mature elements of the organization.
The weakness lies in what the system is for.
Target Setting scores 3.1 — targets are set with limited analysis and limited stakeholder involvement, assigned rather than agreed, which converts measurement into compliance.
Data Visualization (3.0) indicates that accurate data is reported but not communicated: the numbers arrive on schedule without shaping a narrative or a decision.
PM Enablers (2.9), the lowest dimension in the profile, shows that the communication, skills development, and governance surrounding the system have not kept pace with the system itself.
The contrast can be stated simply. Organization A must build the machinery its people currently compensate for.Organization B must build the engagement its machinery currently substitutes for. Both scored 3.7 — and no useful recommendation could be written from that number alone.
Two Roadmaps for Improvement
If the assessment stopped at the scores, both organizations would receive the same message: you are at 3.8 in Strategic Planning and 3.7 in Performance Measurement; aim for the next level. The dimension profiles make it possible to say something far more useful — and the two resulting roadmaps point in opposite directions.
One signal is worth noting before the recommendations, because it frames both roadmaps. Each capability includes an Enablers dimension — the governance, documentation, technology, communication, and skills development that surround the system. For Organization A, Enablers are a quiet strength (Strategy Enablers 4.6, PM Enablers 4.5). For Organization B, they are a systematic weakness (3.0 and 2.9). This tells the assessor two things: Organization A has the supporting infrastructure to absorb new processes quickly, and Organization B's gaps are not isolated — the same underinvestment in people, communication, and skills recurs across capabilities, consistent with its capability-level scores in Performance Culture and Employee Performance Management (both 3.6).
Recommendations
Organization A: build the machinery the culture is compensating for
Strategic Planning
Articulate the strategy into a formal architecture — concrete objectives, KPIs, and initiatives, supported by monitoring tools such as a corporate scorecard and strategy map. This targets the weakest dimension in the profile (Strategy Articulation, 2.9) and converts a strategy that lives as shared understanding into one that can be monitored and evidenced.
Formalize the cascading process (Strategy Alignment, 3.0): operational plans explicitly derived from corporate objectives, with defined accountability, and integration of strategy with risk management and sustainability considerations.
Strengthen the research base behind strategy definition (Strategy Formulation, 3.3): structured internal and external environment analysis and systematic stakeholder input, so that formulation matches the quality of the foundations it rests on (4.7).
Performance Measurement
Standardize KPI selection beyond the corporate level (KPI Selection, 3.0): formal filtering criteria, naming standards, and a defined cascading method, paired with a rationalization of the KPI library to keep only what informs decisions.
Build comprehensive KPI documentation (KPI Documentation, 2.9): a standard template covering definitions, calculation formulas, data sources, and owners, so that the same indicator means the same thing in every team.
Formalize and progressively digitalize data gathering (Data Gathering, 3.1): a data collection calendar, standard templates, assigned data custodians, and reduced dependence on manual centralization.
The two workstreams reinforce each other: strategy cannot be articulated into KPIs that are not properly selected and documented, so articulation and documentation should advance together. The good news for Organization A is its starting position — with Enablers scores of 4.6 and 4.5, the governance, skills, and communication needed to implement these changes already exist. The discipline to manage is restraint: formalize what the culture already does well without replacing trust with bureaucracy. Strong Target Setting (4.3) and Data Visualization (4.4) will amplify the new foundations quickly once reliable, standardized data flows through them.
Organization B: build the ownership and adaptability the machinery is substituting for
Strategic Planning
Establish strategic resilience practices (Strategic Resilience, 2.9 — the lowest dimension in the profile): a regular strategy review cadence, foresight and scenario analysis, and contingency planning, so the plan is stress-tested rather than simply executed.
Re-anchor the strategy in its foundations (Strategy Foundations, 3.0): revisit the mission, vision, and values with genuine leadership involvement, and embed them in communication and decision-making — an exceptional plan gains durability only when people recognize themselves in its direction.
Invest in Strategy Enablers (3.0): strategy communication beyond formal reporting, planning guides and assistance for managers, and skills development that spreads planning capability beyond the strategy function.
Performance Measurement
Make target setting analytical and participatory (Target Setting, 3.1): targets informed by in-depth analysis and shaped with the stakeholders who must deliver them. Targets that are agreed rather than assigned are the single most direct lever for converting compliance into commitment.
Develop data visualization and storytelling capability (Data Visualization, 3.0): the data is accurate and timely; the missing step is communication that turns reports into narratives that shape decisions.
Strengthen PM Enablers (2.9): performance communication routines, measurement skills development across the organization, and governance that positions data as a shared asset rather than a reporting obligation.
Organization B's roadmap deliberately adds no new machinery. Its selection, documentation, and data collection processes are already at the Advanced level; extending them further would deepen the existing imbalance. Every recommendation instead directs the organization's process discipline toward its people — and this is where the roadmap connects to the wider profile, because the same intervention logic will carry into Performance Culture and Employee Performance Management, its two weakest capabilities. The risk to manage is credibility: participation and communication introduced as procedures will be recognized as procedures. Leadership behavior, not documentation, determines whether this roadmap works.
Same Score, Opposite Directions
Organization A and Organization B entered the assessment with the same overall maturity of 3.9, the same 3.8 in Strategic Planning, and the same 3.7 in Performance Measurement. They left it with improvement plans that share almost nothing. One must build the structures its culture has been compensating for; the other must build the ownership its structures have been substituting for.
Get our research first in Google Search and AI Mode.
Overall
Dr. Adrian Brudan Featured by GulfApex for Leadership in Performance Excellence
GulfApex has featured Dr. Adrian Brudan, CEO and Co-Founder of GPA Unit, in its Leadership Feature series.
GPA Unit Welcomes ALANSARI CONSULTING to Its Partner Network as an Associate Partner in the Kingdom of Bahrain
GPA Unit has welcomed ALANSARI CONSULTING as an Associate Partner in Bahrain, expanding access to internationally recognized, evidence-based strategy and performance assessments across Bahrain and the wider GCC.
How to Become a GPAU Employee Performance Management Accredited Assessor
The GPAU Employee Performance Management Assessor pathway develops professionals from certification to authorization and supervised client accreditation, building competence to assess how consistently organizations manage and improve employee performance.
GPA Unit Welcomes EFQM CONSULTING to Its Partner Network as an Associate Partner in the United Arab Emirates
GPA Unit has welcomed EFQM CONSULTING as an Associate Partner in the UAE, expanding access to internationally recognized, evidence-based strategy and performance maturity assessments across the market.
How to Become a GPAU Strategic Planning Accredited Assessor
How to Become a GPAU Strategic Planning Accredited Assessor The pathway to becoming an Accredited Assessor The GPAU assessor pathway provides a structured route from professional education to supervised assessment practice.